다음과 같이 생긴 노드-간선 그래프를 그리려고 한다.
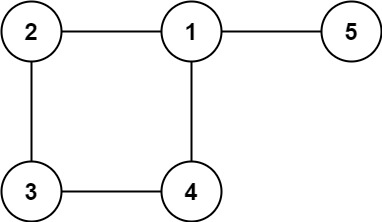
간선 데이터가
edges = [[1,2],[2,3],[3,4],[1,4],[1,5]]와 같은 식으로 주어진다고 할 때, 그래프(Graph) 자료구조를 시각화하는 HTML, JS, CSS 코드는 다음과 같다(D3.js 라이브러리 활용):<!DOCTYPE html> <html> <head> <title>Graph Visualization</title> <script src="https://d3js.org/d3.v3.min.js"></script> <style> .link { stroke: #999; stroke-opacity: 0.6; } .node { fill: #ccc; stroke: #fff; stroke-width: 1.5px; } </style> </head> <body> <script> // 간선 데이터 var edges = [ { source: 1, target: 2 }, { source: 2, target: 3 }, { source: 3, target: 4 }, { source: 1, target: 4 }, { source: 1, target: 5 } ]; // 노드 데이터 생성 var nodes = {}; edges.forEach(function (edge) { edge.source = nodes[edge.source] || (nodes[edge.source] = { id: edge.source }); edge.target = nodes[edge.target] || (nodes[edge.target] = { id: edge.target }); }); // SVG 요소의 크기 var width = 800, height = 600; // D3.js force layout 설정 var force = d3.layout.force() .nodes(d3.values(nodes)) .links(edges) .size([width, height]) .linkDistance(150) .charge(-800) .on("tick", tick) .start(); // SVG 요소 추가 var svg = d3.select("body").append("svg") .attr("width", width) .attr("height", height); // 간선을 SVG 선으로 표현 var link = svg.selectAll(".link") .data(force.links()) .enter().append("line") .attr("class", "link"); // 노드를 SVG 원으로 표현 var node = svg.selectAll(".node") .data(force.nodes()) .enter().append("g") .attr("class", "node"); node.append("circle") .attr("r", 20); // 원의 반지름 // 노드에 번호 표시 node.append("text") .attr("dx", -4) .attr("dy", ".35em") .style("fill", "black") // 글자 색을 검정색으로 설정 .text(function (d) { return d.id; }); // 애니메이션을 위한 tick 함수 function tick() { link.attr("x1", function (d) { return d.source.x; }) .attr("y1", function (d) { return d.source.y; }) .attr("x2", function (d) { return d.target.x; }) .attr("y2", function (d) { return d.target.y; }); node.attr("transform", function (d) { return "translate(" + d.x + "," + d.y + ")"; }); } </script> <h1>Hello</h1> </body> </html>
출처: LeetCode #684. Redundant Connection 와 Edge Copilot
Uploaded by N2T